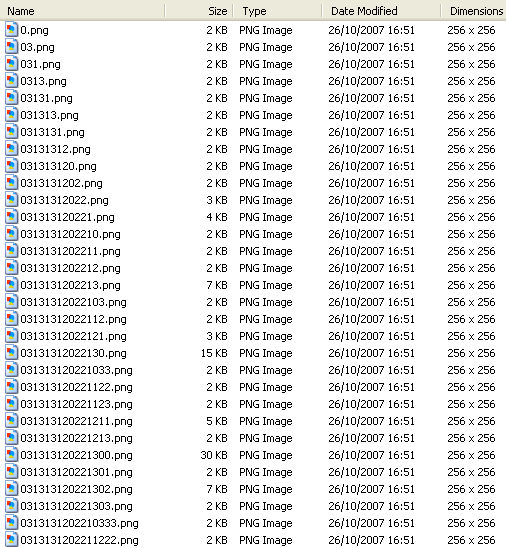
in my case. If you have crunched more than one map you may want to omit some of the low zoom tiles that cover the same area on the ground. Finally here
is the finished online map. Drag the slider by the Caves/Sat map type button to adjust the cave overlay opacity on the Caves/Sat hybrid map. See this page's code (which works fine for Firefox and MSIE7) for more details.
STEP 7 - HOST YOUR MAP ON GOOGLE APP ENGINE
You can use a free Google App Engine account to host
your tile sets.
Currently you can get three App Engine applications, each with 500Mb of storage, per developer (Gmail address).
Each application is limited to 1000 files and no more than 1Mb per file,
see here for more details.
To sign up for an account, you need a website that you can upload to, e.g. a Google Pages site
and a mobile phone to receive a verification text on. You will need to download Python and the App Engine SDK via here.
Having got your account set up, you need to create an Application and so get an
App-Id. Then in one folder, create the following files and folders:
tiles A folder containing your map tiles (up to 999)
App.yaml A file containing the following text (where myapp is your own App-Id)
application: myapp
version: 1
runtime: python
api_version: 1
handlers:
- url: /tiles
static_dir: tiles
- url: /.*
script: MyMap.py
MyMap.py A file containing the following text (where myapp is your own App
Id). This is Python script - correct identation is vital.
import wsgiref.handlers
from google.appengine.ext
import webapp import os
from google.appengine.ext.webapp import template
class MainPage(webapp.RequestHandler):
def get(self):
template_values = { }
path = os.path.join(os.path.dirname(__file__), 'MyMap.html')
self.response.out.write(template.render(path,template_values))
def main():
application = webapp.WSGIApplication( [('/', MainPage),],debug=True)
wsgiref.handlers.CGIHandler().run(application)
if __name__ == "__main__": main()
MyMap.html a test page for your map. If you are using Google's free AppSpot hosting then use a url like
http://myapp.appspot.com/tiles
for your map tiles and of course register http://myapp.appspot.com
for a Google Maps API key to use in MyMap.html .
To recap, you should have a tiles folder, and files named App.yaml,
MyMap.Py and
MyMap.html. You are now ready to upload all of these using the AppEngine SDK
upload utility. Simply open a cmd window, navigate to your folder and enter "appcfg.py update ./ ". If all goes well, you should be able to view your
test map at http://myapp.appspot.com/.
You can of course use your AppSpot hosted tiles from a map hosted anywhere on the web. The big advantage of AppEngine over GooglePages is the bulk upload facility. Only a single file at a time can be uploaded to GooglePages.
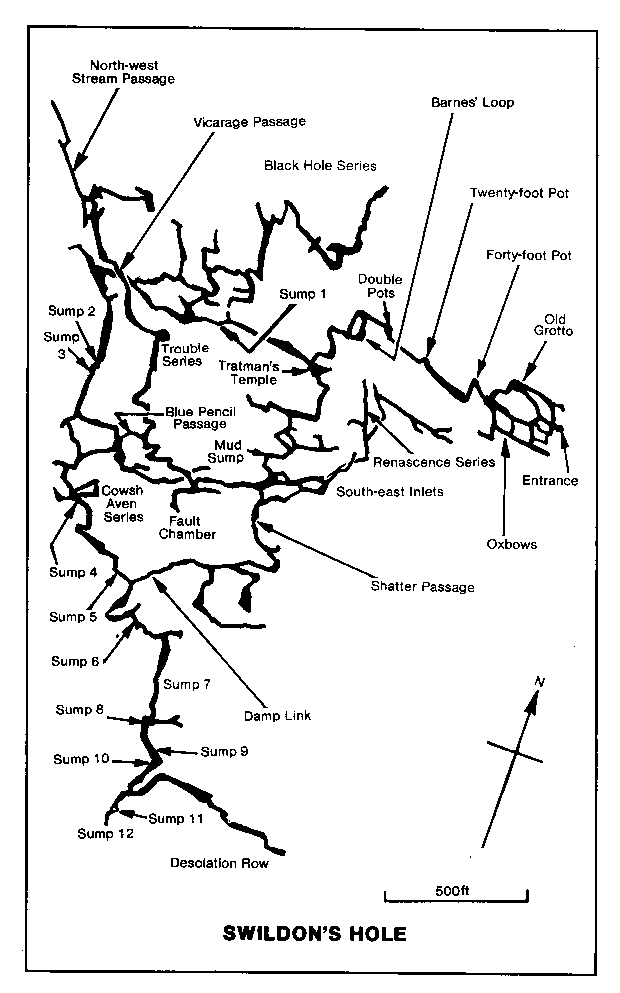
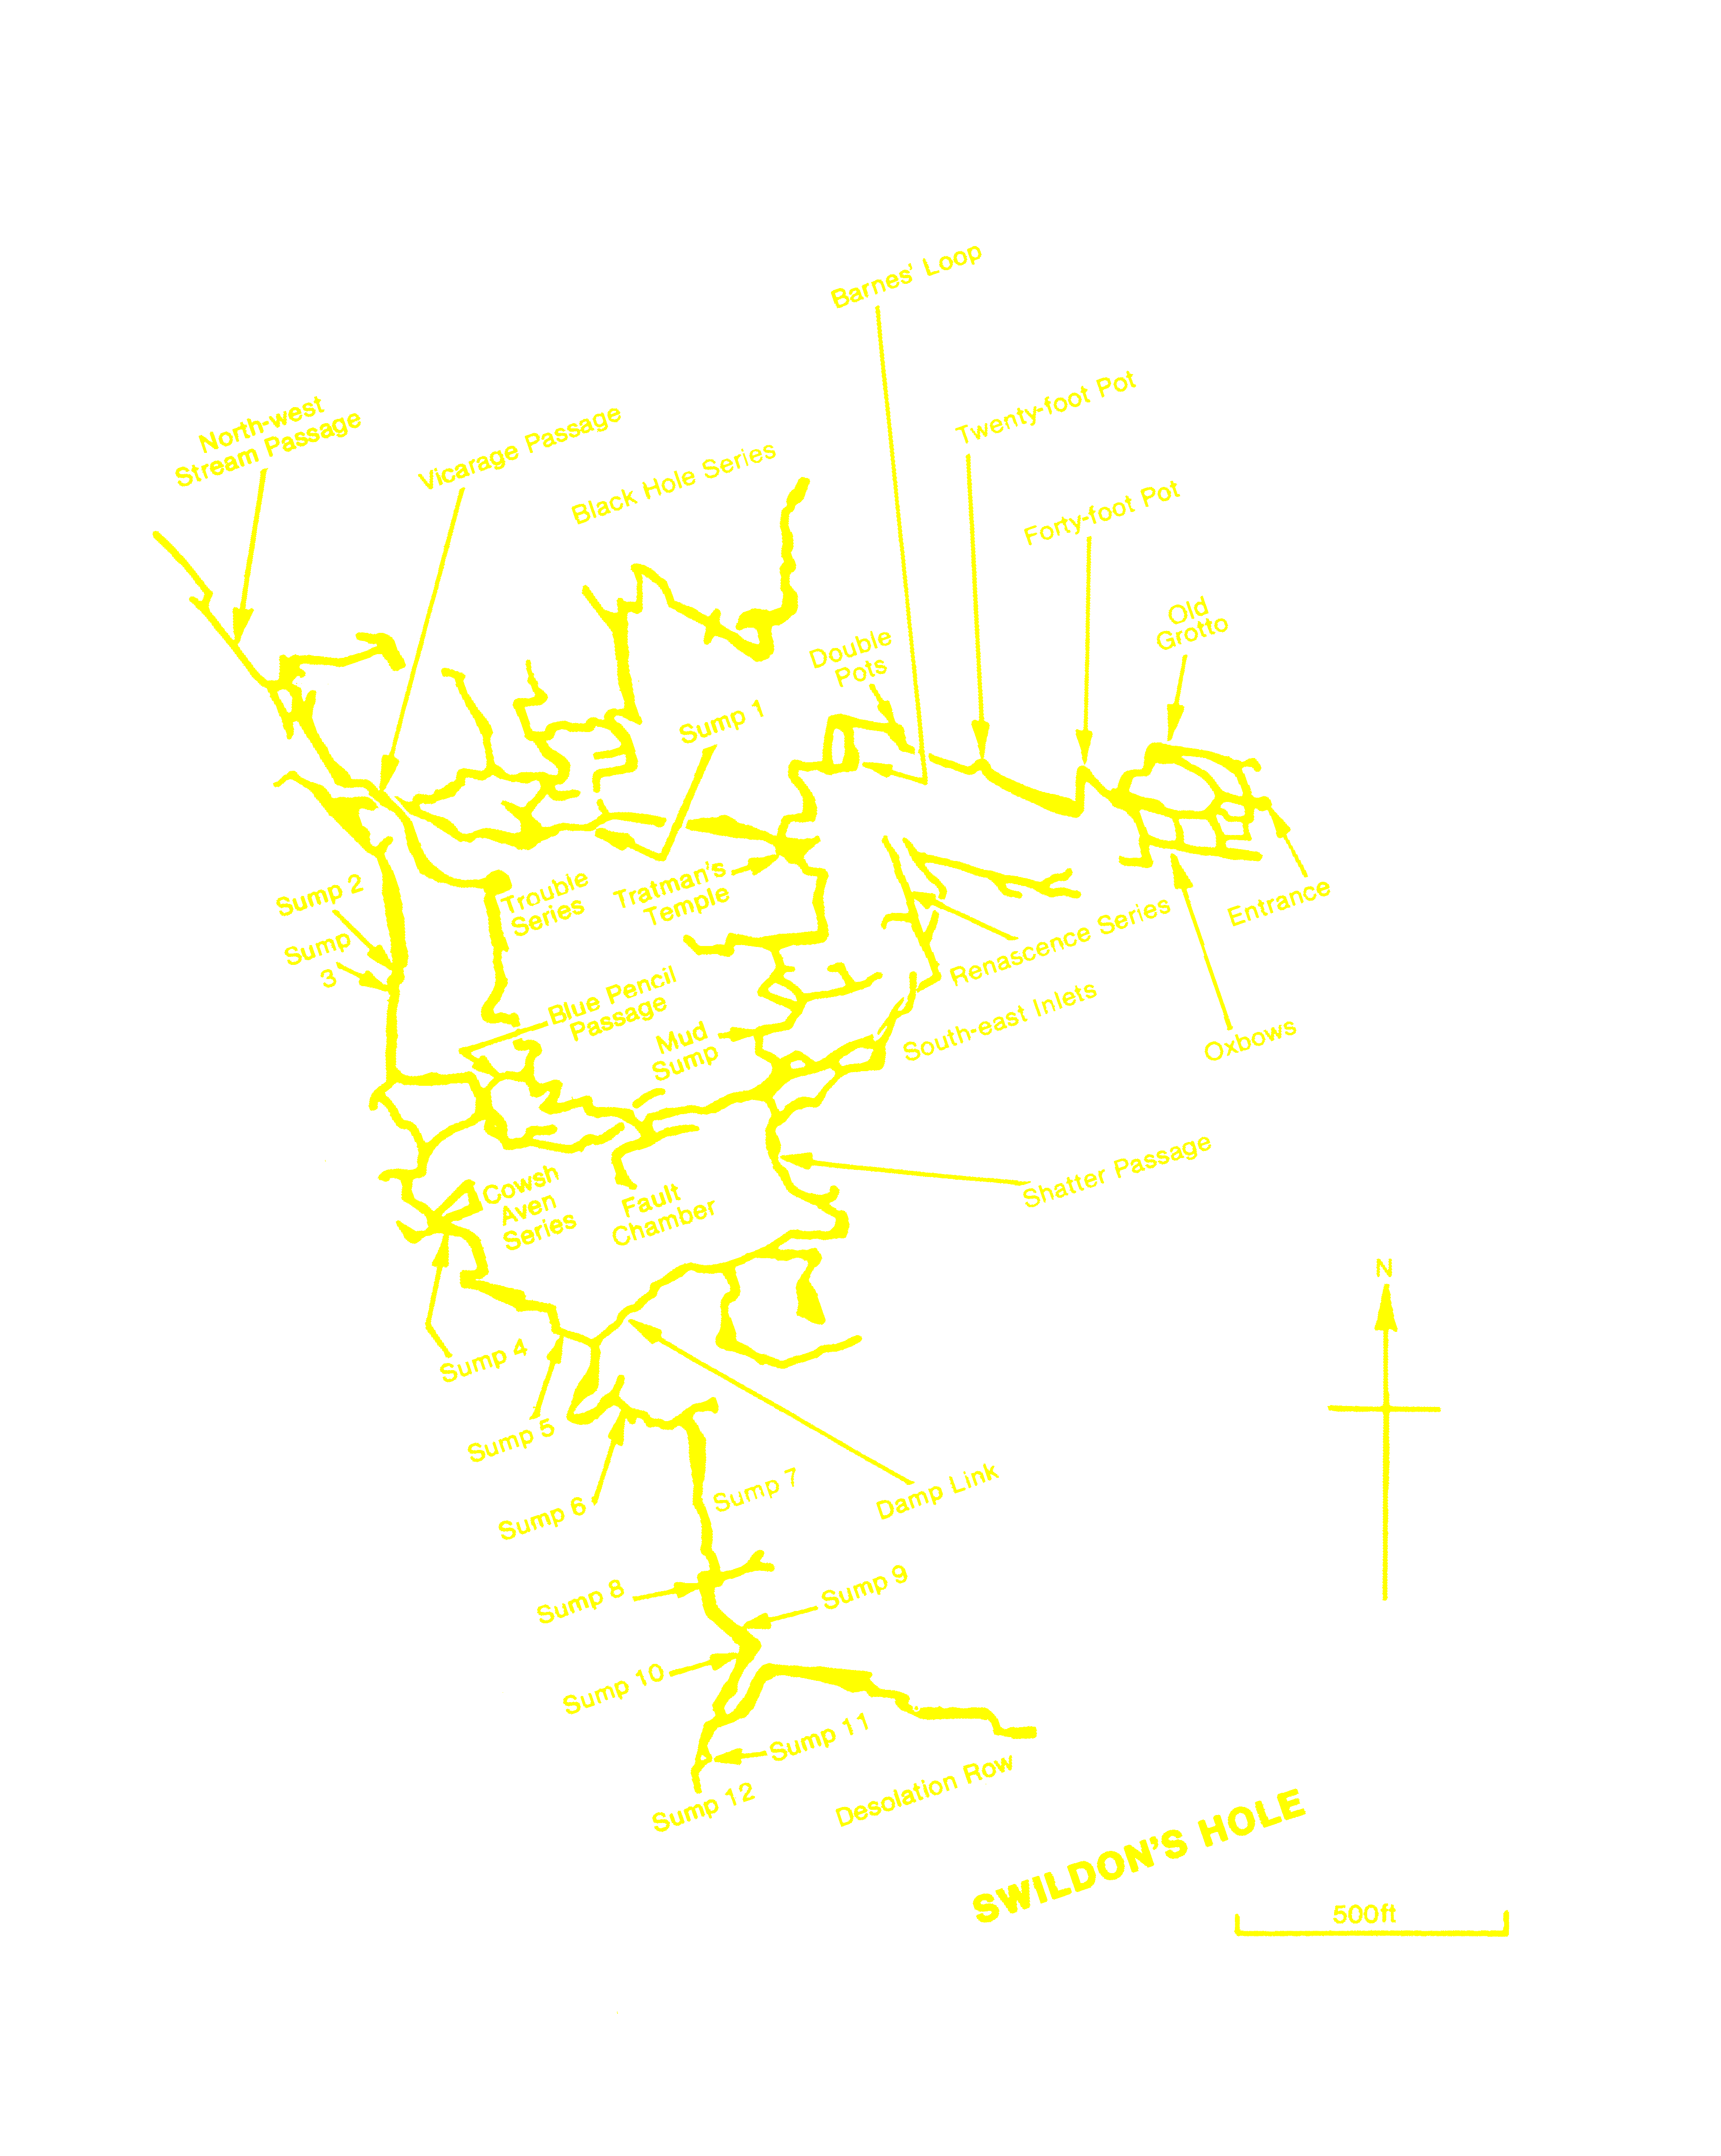
Here is an AppSpot hosting of a cave survey.